

The average Singaporean maintains a healthier debt levels with households owing less than their annual earnings, when compared to many other countries, claims a survey by Quick Loan Pte Ltd.
The debt level is in particular stark contrast to Norway where the average Norwegian household has a debt of 170 % of their annual income, meaning the average Norwegian household carries $30,674 more debt than their entire earning for one full calendar year.
These are among the findings of a new study examining household debt-to-income ratios across multiple countrie. It concludes that Singapore maintains notably healthier financial metrics in this regard than the debt traps affecting Nordic and Commonwealth countries..
The research examined official economic data, including household debt levels, GDP figures, population statistics, and average salaries from multiple countries. The study calculated how much debt the average person owes compared to what they earn annually, creating debt-to-income ratios that show which nations have sustainable borrowing levels and which face potential financial risks.
Here’s how Singapore’s debt-to-income ratio looks like in the survey:
Metric Amount
- Household debt per capita $39,664.94
- Average Yearly Net Salary $52,897.68
- Loan-to-income ratio 74.98%
- Annual surplus (Income – Debt) $13,232.74
You can access the complete research findings here.
Singapore demonstrates a 74.98% loan-to-income ratio. This means that Singapore residents owe significantly less than their annual earnings. With $39,665 in per capita debt against an average yearly salary of $52,898, Singaporean households maintain a surplus of $13,233 between income and debt obligations.
Compared to debt-heavy nations that dominate the global rankings, Singapore’s position looks stable. Norway ranks first as the world’s most loan-dependent country, with households owing 169.79% of their annual income, meaning the average Norwegian household carries $30,674 more debt than yearly earnings. Similarly, Australia, which ranks second, shows households owing 163.37% of annual income, creating debt burdens of $27,288 beyond yearly earnings.
The city-state also positions well when compared to other affluent but small nations. Switzerland, despite having the highest per capita debt globally at $124,786, posts a 143.75% debt-to-income ratio. Luxembourg, with $87,235 per capita debt and $72,789 yearly salary, shows a 119.85% ratio.
“Singapore represents what sustainable household debt shall look like in a developed economy,” says a company spokesperson for the loan expert company QuickLoan.com
“While many other developed nations face a potential household debt crisis, where families owe significantly more than they earn annually, Singapore demonstrates that high living standards don’t require unsustainable borrowing. The city-state’s 75% debt-to-income ratio creates a model other nations might study as they address their own debt sustainability challenges,” says QuickLoan Pte Ltd.
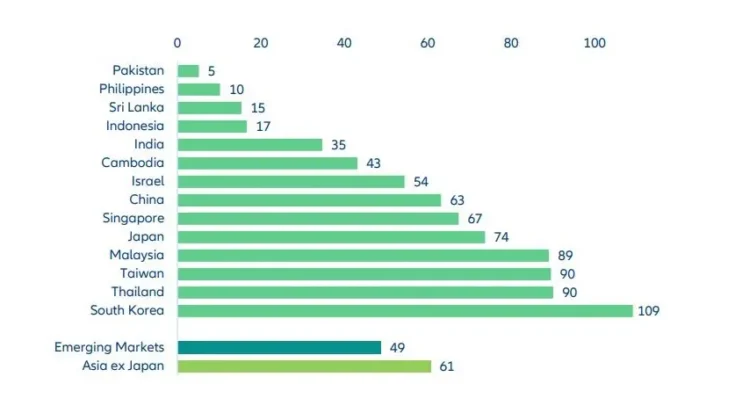
However, if you look at it in another way, comparing household debt to the GDP of the country, Singapore ranks sixth highest in Asia. The highest was South Korea. In the lower end, you will find the Philippines, Indonesia and Cambodia have healthier debts ratios.
The above chart from the Allianz Global Wealth Report 2022 shows the rankings of countries in Asia regarding debt to GDP except Japan based on their debt as a percentage of the gross domestic product (GDP) in 2021 from lowest to highest.
The chart shows that Singapore placed sixth as the highest in the region at 67%. The highest was South Korea at 109%.